Estimating the Risk of Food Stamp Use and Impoverishment During Childhood
Mark R. Rank, PhD ;Thomas A. Hirschl, PhD Arch Pediatr Adolesc Med. 2009;163(11):994-999.
Objective To estimate the lifetime risk that an American child will reside in a household receiving food stamps and, as a result, will encounter poverty and a heightened exposure to food insecurity.Design Thirty years of longitudinal data from the Panel Study of Income Dynamics survey data set.
Setting Nationally representative sample of the US population.
Participants Approximately 90 000 childhood years of information are pooled together to create a series of life tables that span the ages of 1 to 20 years.
Main Outcome Measure Self-reporting measure of whether survey households received the Food Stamp Program during the prior year.
Results Between the ages of 1 to 20 years, nearly half (49.2%) of all American children will, at some point, reside in a household that receives food stamps. Households in need of the program use it for relatively short periods but are also likely to return to the program at several points during the childhood years. Race, parental education, and head of household's marital status exert a strong influence on the proportion of children residing in a food stamp household.
Conclusions American children are at a high risk of encountering a spell during which their families are in poverty and food insecure as indicated through their use of food stamps. Such events have the potential to seriously jeopardize a child's overall health.
UPDATE: Nice new succinct precis on the Food Stamp (now SNAP) program from CBPP.
Monday, November 02, 2009
New Study


Sunday, November 01, 2009
A Panoply of Policy Papers
Saturday, October 31, 2009
Some Health Care Links
Friday, October 30, 2009
Tuesday, October 27, 2009
Ezra Sums Up
Among the many implicit precepts directing health-care reform are the following:
(1) The employer-based system doesn't work, either to assure coverage or control cost.
(2) The employer-based system must be preserved.
(3) A strong public option would offer consumers lower premiums and attract a lot of customers.
(4) A strong public option cannot be included because private insurers cannot effectively compete with it.
(5) Among the worst economic distortions of the system is the fact that employers choose insurance for their employees, and thus employees don't really understand the cost of coverage.
(6) The exchange cannot initially be open to employees, and may never be opened to employees, because they might leave employer-based insurance in order to shop for their own policies more aggressively.
You can go on in this vein, of course. It's a bit of a problem.
Do You Miss the Society for Inoculating the Poor Gratis?
Watching the current debate in Washington, it’s tempting to think of health care reform as something radical and new - an issue that could force a profound shift in national identity. But America has been through this already. More than 200 years prior to this year’s push for a new national health policy, Americans were already becoming incensed about how they paid for health care, and who got access to it.Health care in Colonial America looked nothing like what we’d consider medicine today, but the debates it triggered were similar. The danger of smallpox and the high cost of its prevention led to divisive questions about who should pay, whether everyone deserved equal access, and if responsibility lay at the feet of the individual, the state, or the nation. Epidemics forced the early republic to wrestle with the question of the federal government’s proper role in regulating the nation’s health.
Colonial leaders and ordinary people alike possessed a similar sense that a proper solution to these issues would determine the brightness and shape of America’s future. At times conflicts over public health threatened the social and political fabric of communities. Did these rowdy Colonials, with the aid of the Founding Fathers, solve these dilemmas? Hardly. But their observations, questions, and compromises offer a useful lesson for what we can expect as we find ourselves again with health care in the forefront of the national conversation.
The rest here.
Broadway to Washington Square
Ms. White never mentioned to the others who slept in the park that she had been nominated for a Tony award when she performed, alongside Glenn Close, in “Barnum,” in 1980; nor did she ask about their pasts. Severely depressed, she was too proud to reach out to social services, and kept the extent of her problems from friends. “Most of them are barely getting by in their tiny apartments as it is,” she said. “People in New York, they need their patterns. You can’t interrupt them.”
To avoid the police, Ms. White usually alternated sleeping for an hour with walking for an hour, which is what she was doing when she ran into Officer David Taylor on Grove Street at 4 a.m. one day last fall. Officer Taylor had come to know Ms. White when he was patrolling the West Village. He admired her energy, and, off-duty, came to see her perform. He had never seen her looking like she did on Grove Street. “She is usually someone who lifts your energy if you’re feeling down,” he said. “That night she looked soulless. I was concerned for her — scared.”
Read the rest.
Monday, October 26, 2009

Friday, October 23, 2009
Wednesday, October 21, 2009
Shrewd Politics Meets Sound Policy?
Wednesday, October 14, 2009
Tuesday, September 29, 2009
Poor in NYC
The Bronx remained the country’s poorest urban county; the income gap in Manhattan was still higher than in any other county; and the poverty rate in Connecticut rose faster than in any other state.
And the relatively positive part of the local economic picture was tempered by the fact that the latest census figures from the rolling American Community Survey captured only the start of the recession.
In New York City, the poverty rate in 2008 was 18.2 percent — the lowest this decade — compared with 18.5 percent in 2007. Median household income was unchanged, at $51,116, but median family income rose to $56,552 from $54,846.
Those figures masked vast disparities, though, based on race, ethnicity and geography.
In the Bronx, the median household income was $35,033, and nearly 28 percent of the borough’s residents — and 47 percent of its households headed by women with children — were living in poverty.
Citywide, the poverty rate for racial and ethnic groups stayed relatively unchanged in 2008 compared with the previous year: 11 percent for non-Hispanic whites, 17 percent for Asians, 21 percent for blacks and 26 percent for Hispanics.
The proportion of people receiving food stamps increased in New York State by about a percentage point, to 10.6 percent.
Wednesday, September 23, 2009
Tuesday, September 22, 2009
Sunday, September 20, 2009
Thursday, September 17, 2009
Wednesday, September 16, 2009
Some Commentary on Today's Bartels Readings
- Jim Manzi at the American Scene
- Tyler Cowen at Marginal Revolution
- Andrew Gelman at the Monkey Cage
- Economics of Contempt, some more Gelman
- And, Bartels responds to some critiques at Dani Rodrik's


Friday, September 11, 2009
"Entirely Arbitrary"
Thursday, September 10, 2009
New Census Data
Using data from the Congressional Budget Office (CBO) and others about the likely trajectory of the recession, we find that, absent other changes, the poverty rate will increase rapidly through 2011 or 2012, at which point about 14.4 percent of the country will be in poverty, up from 12.5 percent in 2007. As the recession ends and employment levels increase, the poverty rate will begin to steadily decrease though it will not, at least over the next decade or so, reach its 2007 level. In short, our results show that recessions can have long-term scarring effects for all workers but especially for the most disadvantaged, whose skills and attachment to the work force are already somewhat marginal. A prolonged lack of jobs reduces the amount of on-the-job training or experience that people receive, discourages them from making the effort needed to climb out of poverty, and can even lead to a deterioration in their health or family life that adversely affects opportunity.UPDATE:


Tuesday, September 08, 2009
"Eight Questions About Health Care Reform"
Wednesday, September 02, 2009
Budget Docs
- Budget of the U.S. Gov't, Updated Summary Tables (May 2009)
- U.S. Federal Budget, the Wiki
- Budget Explorer, with some simulations and budget-balancing exercises
- Introduction to the Federal Budget Process, from CBPP
- Treasure Trove of Tools to Understand the Federal Budget Process, from Congress Matters
- OMB, CBO, Recovery.gov (track A.R.R.A., the "stimulus bill")


Tuesday, September 01, 2009
Income and Ideology

From The Monkey Cage, where Andrew Gelman writes of these charts: "There are some differences between the different measures of ideology, but the take-home point for me is that the patterns are basically consistent: liberal Democrats by any measure are pretty well distributed across the income scale, and conservative Republicans are more concentrated among the upper incomes."
Sunday, August 30, 2009


Friday, August 28, 2009
Thursday, August 27, 2009

Monday, August 24, 2009
Sunday, August 23, 2009

Saturday, August 22, 2009
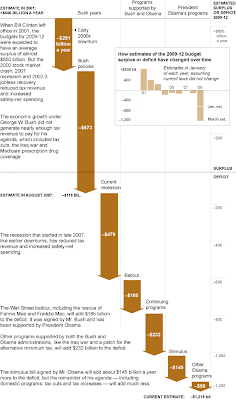
Understanding Upcoming Deficit Estimates
Next week, the President’s Office of Management and Budget (OMB) and the Congressional Budget Office (CBO) will update their economic and budget projections for fiscal year 2009, which ends on September 30, and the next ten fiscal years.[1] Some analysts and pundits will try to use the new projections to support their arguments that the February stimulus package is (or is not) working, that Congress must (or must not) proceed with health care reform, and that any number of other policies should (or should not) be pursued. In fact, however, it will be extremely hard to draw any reasonable conclusions about such questions. Instead, the new estimates are likely to provide more evidence that we are in a highly uncertain economic and budgetary environment, in which the estimates can fluctuate significantly for a variety of reasons that have little to do with the desirability of undertaking new policy actions such as health care reform.
1. Both reports will undoubtedly show that this year’s deficit will be the largest since the end of World War II, relative to the size of the economy. This is no surprise, since CBO and OMB projected a post-war record deficit for this year as long ago as January and February. The new projections almost certainly also will continue to show deficits improving over the next few years as the economy recovers, although the projected improvement will likely be slower than in previous recoveries and deficits will remain troublingly high.
2. There will be no simple answer to the question of whether the new projections are bigger or smaller than was expected earlier this year. This is because OMB and CBO have each produced at least four different sets of projections over the last eight months, ranging from $1.19 trillion (CBO’s estimate in January if current policies were continued) to $1.84 trillion (estimated by CBO in March and OMB in May). Those estimates vary according to which organization produced them, what policies it assumed in making them, and when it made them. (See Appendix for a description of the various deficit estimates made by OMB and CBO since January.)
The new estimates for 2009 will certainly be higher than $1.19 trillion. The Department of the Treasury reported earlier this month that in the first ten months of fiscal year 2009 (through July), the deficit already totaled $1.27 trillion. Although the federal government normally runs a surplus in September because of quarterly income tax payments, it is unlikely to do so this year, and it is inconceivable that any September surplus would be enough to offset more than a fraction of the likely large addition to the deficit in August.
It is not clear whether the new estimates will exceed $1.84 trillion (although as noted in footnote 1, it has been reported that OMB’s estimate will be $1.58 trillion). Some observers have suggested that recent data revisions showing the economy was weaker in 2008 and in the first quarter of this year than previously reported indicate that the fiscal year 2009 deficit will be higher than earlier projections. But the actual performance of the economy through March has already been reflected in the revenues collected and expenditures made to date, which will be the primary basis for OMB’s and CBO’s new deficit estimates. Thus, the revisions themselves are likely to have little effect on any changes made in this round of estimates of the 2009 deficit.
3. Whether the new estimates exceed $1.84 trillion will likely depend on the amounts recorded for a particularly volatile category of spending: assistance to troubled financial institutions. CBO’s March estimate of a $1.84 trillion deficit included more than $330 billion in spending for the Troubled Asset Relief Program (TARP) enacted last fall,[2] plus $125 billion from legislation the President was seeking to provide additional authority for TARP activities.[3] However, Congress has not considered the legislation providing new authority for TARP, and through July the Treasury Department had recorded only $169 billion in TARP costs under existing authorities for 2009.
Similarly, the costs recorded for the federal government’s support of two ailing government- sponsored enterprises — the Federal National Mortgage Association (Fannie Mae) and the Federal Home Loan Mortgage Corporation (Freddie Mac) — will substantially affect the deficit for 2009. Government-sponsored enterprises are privately owned organizations that generally are not considered part of the federal government; their transactions with the public are not included in the budget. CBO believes, however, that the decision last year to put Fannie Mae and Freddie Mac into conservatorship under the control of the Federal Housing Finance Agency essentially represents a federal takeover of the two organizations. CBO argues that the activities of the two organizations should now appear in the budget and that the long-term costs related to Fannie’s and Freddie’s commitments as of the takeover, as well as the full costs of their ongoing activities, should be recorded in the budget as a cost in 2009. CBO estimates these costs exceed $290 billion.
OMB, in contrast, continues to treat Fannie Mae and Freddie Mac as private entities that are not fully reflected in the budget. It includes only direct payments from the Treasury to Fannie and Freddie as a budget expense. So far this year, the Department of the Treasury has recorded just over $80 billion in such costs.
4. The new projections won’t provide any evidence about whether the stimulus legislation is working or whether Congress and the President should continue to pursue health care reform. Not only will it be hard to say whether the projections clearly show an improvement or worsening in the fiscal outlook (better or worse than what?), but the factors that are likely to determine the final size of the deficit in 2009 — the costs recorded for TARP and for Fannie Mae and Freddie Mac — have nothing to do with questions that some are hoping the new projections will answer.
Lower-than-anticipated costs for TARP may indicate that the problems in the financial system have stabilized, but they will not provide any evidence one way or the other about the impact of the stimulus legislation. In fact, it is hard to know in general what a bigger or smaller deficit would mean about the stimulus. On the one hand, a bigger deficit might mean that the stimulus package’s tax cuts and spending increases are taking effect faster than expected — repudiating claims that the stimulus bill is not working because it is taking too long to implement. On the other hand, some could regard a bigger deficit as an indication that the stimulus is not producing the intended improvement in the economy.
5. The only clear conclusion that should be drawn from the new deficit estimates is the continued need for action on long-term deficits. The new estimates should not spur efforts to reduce deficits in the next few years beyond what Congress has already endorsed in its budget resolution for fiscal year 2010. The extremely high deficits projected for 2009 and the next few years largely result from the most serious economic downturn since the Great Depression and the steps taken to keep it from becoming even worse. Trying to reduce deficits in the short run would be counterproductive to those efforts and could stall or reverse the economic recovery.
The estimates should, however, reinforce the message that the current fiscal path is unsustainable over coming decades. (The policy path was unsustainable before the economic downturn; in fact, the downturn will add relatively little to the size of the long-term problem.[4]) Changes in current policies — such as to ensure adequate revenues and help slow the rapid growth of public and private health care costs — must be made to keep deficits from growing rapidly in coming decades to levels substantially higher than this year’s, even if the economy is operating at full capacity. The President and Congress should begin immediately to demonstrate they are serious about bringing deficits in the medium term (five to ten years from now) down to reasonable levels and avoiding an explosion of deficits in the longer term.
Friday, August 21, 2009
U.S. vs. Them
An analysis from the Urban Institute looks at the evidence on how quality of care in the United States compares to that in other countries and provides implications for health reform. Authors Elizabeth Docteur and Robert Berenson find that international studies of health care quality do not in and of themselves provide a definitive answer to this question.
What they do show is that the evidence for American superiority in quality of care (or lack thereof) is a mixed bag, with the nation doing relatively well in some areas—such as cancer care—and less well in others—such as mortality from treatable and preventable conditions.
And while evidence base is incomplete and suffers from other limitations, it does not provide support for the oft-repeated claim that the “U.S. health care is the best in the world.” In fact, there is no hard evidence that identifies particular areas in which U.S. health care quality is truly exceptional.
Addressing the American public’s widespread concern about the potential negative impact of health reform on the quality of care they currently receive, the authors conclude that reform should in fact be seen as an opportunity to systematically improve quality of care, rather than a threat to the existing system. It provides an opportunity to build on strengths and correct weaknesses in U.S. health care, working towards aims for improvement that the care provided is safe, effective, patient centered, timely, efficient and equitable.
Wednesday, August 19, 2009
Tuesday, August 18, 2009

Saturday, August 15, 2009
Friday, August 14, 2009
I want to be Kathleen Hall Jamieson. . .
Wednesday, August 12, 2009

Lessons from Abroad
Thursday, July 23, 2009
Friday, July 17, 2009
Monday, July 13, 2009
Summer Hunger
The number of low-income children who are
receiving free and reduced-price lunch during the
regular school year is an excellent indicator of the
need for the Summer Nutrition Programs, so FRAC
uses it as a benchmark to measure summer
participation nationally and in the states. While the
total number of children participating in Summer
Nutrition grew by more than 49,000, or 1.7
percent, from July 2007 to July 2008, the number
of children enrolled in the regular year school lunch
program grew faster so that the reach of Summer
Nutrition decreased slightly. In July 2008, 17.3
children received Summer Nutrition for every 100
low-income students who received lunch in the
2007-2008 school year, compared to a ratio of
17.5:100 children in July 2007.
The disparities in participation among the 50 states
plus the District of Columbia are dramatic. Only 10
states managed to reach at least one quarter of
their low-income children in July 2008. The District
of Columbia, followed by New Mexico, South
Carolina, Nevada and New York had the highest
rates for Summer Nutrition participation by lowincome
children.
Eleven states failed to even serve one-tenth of
their low-income children through their Summer
Nutrition Programs in 2008. Mississippi, Oklahoma,
Kansas, Louisiana, and Colorado had the lowest
rates for Summer Nutrition participation by lowincome
children in July 2008.
The full Report is here.
Friday, July 10, 2009
Poverty and the Safety Net
The good news is that the safety net reduces poverty substantially and is more effective at reducing poverty than has generally been recognized. When both broad social insurance benefits such as Social Security and programs targeted on low-income people such as food stamps are considered, the safety net lifts tens of millions of people out of poverty. More specifically, in 2005 (the latest year for which comprehensive data are available), the safety net as a whole:
- Cut the number of Americans living in poverty by nearly half (44 percent), lifting 31 million people above the poverty line.[1]
- Reduced the severity of poverty for those who remain poor, increasing their average disposable income from 29 percent of the poverty line to 64 percent.
- Helped protect Americans from the deepest extremes of poverty, cutting by 7.3 million — or more than three-quarters — the number of children living below half the poverty line. It also lifted 8.0 million children above three-quarters of the poverty line. (This analysis uses a poverty line equal to about $21,400 in 2005 for a couple with two children in a community with average housing costs, consistent with NAS recommendations.)
- Was more effective at lifting children in less-deeply-poor families from just below the poverty line to above the poverty line than it had been a decade earlier. Among children whose non-benefit income was between 75 percent and 99 percent of the poverty line, public programs lifted 65 percent above the poverty line in 2005, up from 51 percent in 1995.
The bad news is that the safety net has weakened over the last decade for families with children that have the lowest incomes and are in greatest need of help due to joblessness or other crises. In 2005, the safety net as a whole:
- Protected a smaller share of children from deep poverty than it used to. In 1995, the safety net lifted above half the poverty line 88 percent of children whose family incomes were lower than that before counting safety net benefits. By 2005, this percentage had declined to 76 percent. If the safety net had been as effective at keeping children out of deep poverty in 2005 as it was in 1995, there would have been 1.1 million very poor children in 2005; instead, there were 2.4 million.
- Protected fewer jobless workers from deep poverty than it used to. Among very poor unemployed workers looking for work in any given week, the safety net lifted 60 percent above half of the poverty line in 2005, down from 70 percent of very poor unemployed workers in 1995. [2]
Since these data were collected, the economy has entered a major recession, and Congress enacted the American Recovery and Reinvestment Act, designed to boost economic growth and ameliorate the harshest impacts of the recession on struggling families. The recovery package included many provisions that strengthen the safety net, though in most cases the improvements are designed to be temporary. These include a temporary boost in food stamp benefits, temporary expansions in the Earned Income Tax Credit and the Child Tax Credit, new incentives for states to make their unemployment insurance systems more accessible to jobless workers, and new funding for states that see an increase in the number of families receiving basic cash assistance through TANF programs and states that expand short-term help and subsidized employment programs for poor families.
These provisions will soften the impact of the recession on the extent and depth of poverty. (A previous Center analysis projects that the expansions in the EITC, Child Tax Credit, and the new Making Work Pay tax credit will stop 1 million children from falling below the poverty line. [3]) When the recession abates, it will be important to measure precisely the impact of these temporary measures and consider what longer-lasting improvements should be made in the safety net.

Saturday, June 20, 2009
Wonk Resource Reminder
Monday, June 01, 2009
Wednesday, May 20, 2009

Friday, May 15, 2009
Sunday, May 10, 2009
Sunday, May 03, 2009
Sunday, April 19, 2009
On "The Wire"
Friday, April 17, 2009


Wednesday, April 15, 2009

Thursday, April 02, 2009
Fun with Sub-Committee Hearings!
Wednesday, April 01, 2009
Sunday, March 29, 2009
Why No Riots?
But it was only several years after the stock market crash that large-scale protests, bread riots and street rebellions began to occur in small towns and big cities. That’s the most pertinent lesson of the Great Depression: people waited, with relative patience, for years for some government response before anyone looted a grocery store or fought off police officers who were evicting families. So it’s possible that if our economic hardships endure, civil unrest could follow.
But if American anger remains corralled on the Internet, into e-mail messages to Congress and in sporadic small-group protests, it is unlikely that the Obama administration will do much to assuage the anger of taxpayers. Administration officials certainly don’t seem concerned that rage will heat up and overflow; after all, anticipating unrest would mean a broad and intensive campaign to shore up housing, food and welfare safety nets. The proposed budget contains a few such line items, but a comprehensive, coordinated program to prevent violence and defuse anger would need sustained commitments from mayors, service providers and civic leaders.
Perhaps the lack of concern is warranted, as several factors make widespread revolt less likely today. Our cities are no longer dense, overcrowded industrial centers where unionized laborers and disgruntled strikers might take a public stand. Concentrated inner-city poverty has declined, too, so don’t expect 1960s-style ghetto unrest.
Our urban centers are instead corporate hubs and the victims of this recession include hundreds of thousands of white-collar workers. For obvious reasons, these folks tend not to have the particular sense of grievance — that a select few are receiving preferential treatment, that they’re on the losing end of a rigged game — that usually sets off a conflagration.
And in today’s cities, even when we share intimate spaces, we tend to be quite distant from one another. Mass disturbances are not highly orchestrated ballets. They require spontaneous interaction, a call and response among unidentified cries of rage, the possibility for a unified mass to form from a gathering of loosely connected individuals.
But these days, technology separates us and makes more of our communication indirect, impersonal and emotionally flat. With headsets on and our hands busily texting, we are less aware of one another’s behavior in public space. Count the number of people with cellphones and personal entertainment devices when you walk down a street. Self-involved bloggers, readers of niche news, all of us listening to our personal playlists: we narrowly miss each other. Effective rebellions require that we sing in unison.
Thursday, March 26, 2009
More Tent Cities

From the NYT:
Like a dozen or so other cities across the nation, Fresno is dealing with an unhappy déjà vu: the arrival of modern-day Hoovervilles, illegal encampments of homeless people that are reminiscent, on a far smaller scale, of Depression-era shantytowns. At his news conference on Tuesday night, President Obama was asked directly about the tent cities and responded by saying that it was “not acceptable for children and families to be without a roof over their heads in a country as wealthy as ours.”
While encampments and street living have always been a part of the landscape in big cities like Los Angeles and New York, these new tent cities have taken root — or grown from smaller enclaves of the homeless as more people lose jobs and housing — in such disparate places as Nashville, Olympia, Wash., and St. Petersburg, Fla.
In Seattle, homeless residents in the city’s 100-person encampment call it Nickelsville, an unflattering reference to the mayor, Greg Nickels. A tent city in Sacramento prompted Gov. Arnold Schwarzenegger to announce a plan Wednesday to shift the entire 125-person encampment to a nearby fairground. That came after a recent visit by “The Oprah Winfrey Show” set off such a news media stampede that some fed-up homeless people complained of overexposure and said they just wanted to be left alone.
Read the rest. But remember at all times: this is not new, it is only the scale that has changed. People who are homeless in more ordinary times are no less "deserving."
Monday, March 23, 2009
Thursday, March 19, 2009
"Let these buildings go!"
HOMELESS PEOPLE TAKE OVER VACANT BUILDING IN EAST HARLEM/EL BARRIO
Claim property for low-income neighbors, demand action from city government
El Barrio/East Harlem, NYC. —Homeless people have taken over an empty building in East Harlem, as part of a coordinated push-back against city policies that let buildings stay empty. The building, which is owned by the city, has been completely vacant for decades.
Deborah Dickerson, a homeless woman who is one of the organizers of the takeover, says “This building is dead. The city killed it. We're going in there to revive this building, and there are many more. We're not going to stop until all of these buildings have people in them. Let these buildings go!”
A massive banner hanging from the roof says THEY SAY GENTRIFY/ WE SAY OCCUPY. Community support for the takeover is high, with neighbors rallying on the sidewalk in support of the event. Neighborhood resident and community leader Gloria Quiñones says, “In my forty years of community activism on this issue, I have never seen things get so desperate. Families are doubled and tripled up while there are vacant city-owned properties and no plans to use them to house low-income folks. This is disgraceful! We know the Mayor is a great businessman and he's one of the richest people in the world, he can do much better than having poor people living on the streets.”
Local elected officials are also signaling their support for the takeover. East Harlem City Council Member Melissa Mark Viverito stated “Today's action is an exciting development and should send a message that the situation has grown too serious to ignore; that low-income New Yorkers are becoming more frustrated as they wait for the city to solve the housing crisis and that we must not hesitate in our search for creative solutions to our most pressing housing challenges.”
Organizers of the building takeover are demanding that the City Council pass new legislation to turn vacant city-owned buildings into housing for the homeless, and a commitment from city officials to conduct an annual citywide count of all vacant buildings and lots.
Dickerson adds, “Being homeless is one of the most degrading things that can happen to any human being. And for too long, people have presumed to speak for the homeless. We have a voice, we are human beings, and we deserve to live. It's too long that the warehousing has gone on. We want housing. Let the warehousing stop. We want to live in a home like everybody else. The city has made enough money on us. We want our legislation to go through. We want the city to count up all these empty buildings and lots. And we want truly-affordable housing for low-income and homeless people.”
Press Rendezvous: Meet at the corner of 116th & Lexington at 12:45PM, Thursday March 19th
For interviews with homeless people and neighborhood residents on the inside of the building, call 718-593-1979. In addition, leaders of the building takeover will be Twittering from the inside. Follow http://twitter.com/pthny and hashtag #bldgtakeover.
Monday, March 16, 2009
Aren't We Generous
When I speak about world poverty at Princeton University, where I teach, or at campuses around the country, students often suggest that America is a generous country: It's already doing its part.
When my students cite American generosity, I show them figures from the Organisation for Economic Co-operation and Development on the amounts given by all the group's donor members. The students are astonished to find that the United States has, for many years, been at or near the bottom of the list of industrialized countries in terms of the proportion of national income given as foreign aid. After several years of vying with Portugal and Greece, we fell to the absolute bottom in 2007. Norway led the way, giving 95 cents per $100, followed by Sweden, Luxembourg, the Netherlands, Denmark, Ireland, and Austria. Other rich countries give less than 50 cents, with the average that year 45 cents; the United States gave only 16 cents of every $100 earned.
The ignorance of Americans about their nation's role in aiding the world's poorest people is widespread, and it has been shown in many surveys. Asked by the Gallup International Association in 2005 whether the United States gives more, less, or about the same amount of aid as other wealthy countries do in terms of percentage of national income, only 9 percent of Americans gave the correct answer; 42 percent of the respondents said the nation gave more than four times as much as was true at the time. At the extreme, 8 percent of Americans thought that the United States gave more than a quarter of its national income as aid, a portion that is more than 100 times as great as the actual amount.
Americans also suffer from gross misconceptions about how significant the country's aid is as a percentage of all federal spending. In four surveys that asked Americans what portion of government spending goes to foreign aid, the median answers ranged from 15 percent to 20 percent. The correct answer is less than 1 percent.
A majority of people in those surveys further said that America gives too much aid — but when asked how much America should give, the median answers ranged from 5 percent to 10 percent of government spending. In other words, people wanted foreign aid cut — to an amount that is five to 10 times as much as their country actually gives.
Read the rest.
Sunday, March 15, 2009
Friday, March 13, 2009
Obama's Health Care Proposal
Friday, March 06, 2009
Music from A People's History of Poverty in America

